Note on hyperspectral telescopes – Looking at Vega
I would like to see a small region of the night sky at high frame rate. The ZWO cameras I have looked at could run 128×128 at 480 frames per second. That lowers the photons per second at the sensor, but the photos each do their bit. And the local noise is uncorrelated. If I run two cameras at once, then even moreso, it is possible to improve the certainty of what comes from the star as opposed from the atmosphere, or the electronics. I have ZWO ASI178MC and ZWO ASI224MC.
I had others but gave them to Houston Astronomical Society, though no one has said if they ever got used. I saw an amateur radio telescope (21 cm line) who only had a 9 degree swath pointed vertically. Running 24/7 is saw that part of the sky in detail. Me, I would let a x200 telescope point at the sky and then capture what it sees. Over time it would cover some of the same things, but the earths rotation is not steady or constant, so that would vary over time. I just needs enough memory to cover that swath in detail, and then layer and statistics for what happens at each pass. I looked into how photons pass though matter (lenses, gases, liquids, field affected materials of all kinds). I would like to design a new way of processing them (photons, signals, fluctuations, wavelets, wavefronts).
Can you tell me what kind of telescopes you use yourself?
I looked at the places you said you work. That one company makes (to me) very expensive and overly complicated telescopes. I do not think it necessary to make compound telescopes, and by fighting the color separation of the lens by making layers and layers of materials – it loses the elegant simplicity of just tracking the lights of different colors. The pixel maps could be done at a nano scale and to precise frequencies. Using the full bandwidth of a camera like these ZWO’s for small regions, it should be possible to demonstrate how to use superresolution methods for hyperspectral astronomy with low cost lenses.
But I have to read hundreds of papers to get tiny bits of data. If you have time perhaps you could let me look at some bits of the sky at high sampling rates. It is a good way to focus all my attention on a small problem. Then, usually, many things are possible.
The pressure of the atmosphere on the earth is about 101325 Pascal. If the acceleration is roughly 9.8 m/s2, that is 101325/9.8 = 10,339.3 KiloGrams per square meter to give that same force per unit area. The atmosphere is only about 500 kilometers thick. So it acts like a turbulent lens to any light or thing traveling at the speed of light and gravity – for 1.66782 milliseconds.
With fixed source, (assuming registration of every frame) those variations spread the light away from the center.
The star Vega is about twice the diameter of the sun, and 25 light years. Its angular diameter is about 3.25 milliArcSeconds. I would say that it is 3.25E-3/(360*60*60) = 2.5 nanoCircles. Its image in photos spreads far beyond the core that would be be the actual star. So (I think, but check my thinking) that most photos are pictures of the stars’ light spread out by the atmosphere and a bit by the lens. If so, then mapping the “atmospheric lens” properties (over time and through different atmospheres and times, might give a way to learn more of what the light at the surface of the stars looks like. What do you think?
Here is a link to Vega in Aladin Lite online. It says 58.75′ FOV. I think that is the full width of the screen. https://aladin.unistra.fr/AladinLite/?target=vega&fov=1.00
And when I fill the screen side to side, it says 22.09′ FOV. And its diameter is 0.00325′. Did I do that right?
It is so bright. It would need a very high frame rate to dim the glare and only see the pixels that come directly. And, if we know that it is small, all the light from radial distances should be from the “atmospheric lens”. Does this sound right?
The light probably “bleaches” the channel. Or, rather, a close tracking sensor restricts its view of the photons it gathers.
So we can learn about the atmosphere, and the azimuthal (around the star from some “North” direction) — variations in intensity. With many many pixels images to check, their average should see small variations that are not related to the atmosphere, but to places on the source. I like to meditate on and study problems like that. But I have no data to do it for real.
Taking a short break, I was thinking about the few Nobel prize winners I have met or seen make presentations.
“You cannot fully explore the future, if you are walking backwards, always looking at the past.” I just made that up, I am sure it is a common thought.
That Aladdin site gives the measured intensities of the source stars. Its flux in photons at different frequencies. Many stars have absolute sizes, distances and spectra. My plan was to use the reference data for known stars — positions, sized of the stars, spectral characteristics and intensities at different wavelengths — to calibrate the pathway, optics, electronic amplification and detectors.
It is possible to put a transparent div over a video or image on any web page – that has the registered and correct star maps – and their data. There are cell phone apps like that where they compass, GPS, accelerometer in the phone tell where the phone is and which direction it is pointed – to identify the sky and what is in in. Or to say what is in the sky – even if you cannot see it. You track the mouse as it hovers and have each pixel (where there is know data) linked to the databases.
Beside the lens and pixel size, the frames per second, amplification (gain), exposure time, threshold, sensor temperature and a few other things also affect what you can record and extract.
Since most of the information needed about the camera is not published, I have been buying them and testing them to see what they are capable of. I can model many things from first principles, but often why bother it somewhere it is possible to measure and work with real data? Every sensor in every network now needs continuous calibration and intercomparisons to get the most out of it for its present purpose, and to use its “noise” for other networks.
Here is a link to the SIMBAD database for vega – https://simbad.u-strasbg.fr/simbad/sim-basic?Ident=Vega
So the image shown in Aladdin Lite for Vega (and most photos) is 319 thousand times larger than the actual diameter.
The diameter is 230 pixels so to see the “real” star seen the way that is shown in the current photos would mean increasing the magnification by 391,174 times. Round it off to a million times more.
But what are we doing with the information? Just looking at it? Stimulate a few brain cells in one dumb human (me)? That is useless. Now, if I take a million photos of this sort, that should give me a million times more information – if I am careful and capture or process it all. Me, I am not afraid of a million images.
What if a million people take a million images of Vega? That is not impossible.
I searched for – magnification of a telescope – and came to wikipedia “optical telescope” then magnification. It gives an example of a 1200 mm focal length lens with a 3 mm objective (3 mm lens on the camera???) to give 400 magnification. So that seems not too hard.
I searched site:astrobin.com “Vega” and found this example.
https://www.astrobin.com/321315/?nc=user
That image is 2000*1279 pixels at 1.258 arc seconds per pixel.
2000*1.258/(60*60) the screen width in arcseconds converted into degrees
2000*1.258/(60*60) = 0.69888 degrees FOV for his photo
I downloaded his photo which showed 1824*1166 pixels. He added gauze to make the photo “pretty”. Light is striking the gauze and sending light to different parts of the pixel array of the sensors radially outward from the star itself. Somewhere in that glare. His saturated image — all the pixels at (255,255, 255) near the center of Vega — goes from 925 to 959 or 34 pixels which he says are 1.258 arcSeconds per pixel. Not sure I trust his numbers just now. But that is 34*1.258/(60*60) degrees = 0.011881 degrees. Now he did not run the camera that long. So the effect of long exposures – with no frames – is to saturate the sensor farther and farther out from the center. That could be blurring in the atmosphere, or movements, or bleeding in the sensor. So he is seeing a truer picture of the star in size terms. His image of the star divided by the degrees of the star itself is
( 34*1.258/(60*60) )/(360*2*2.73/(2*pi*3.40516e+8) ) = (0.011881)/(9.18708537e-7) = 12932.4 times larger than actual. He is closer to the true size than that Alladin image where they let it run a long time to make another “pretty picture”.
I searched for — vega star — and looked for images. I picked this one because it said telescope.com which I think is respectable.
https://www.telescope.com/HIP91262-The-Star-Vega/p/113352.uts
He used an Omni XLT 150 with REBEKE t5i EOS 700D camera for 1/30th second at ISO 1600. So there is LOTS of light at 30 frames per second.
His image is 660×666 and the central saturated image is about 328-311 = 17 pixels
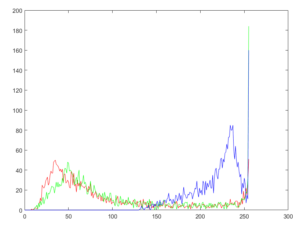
I clipped out a 53*57 pixel area around the star and saved it to a file. I read the image in MatLab and did a histogram to see how many pixels have what values.
It tells me that he set the exposure so that he did not saturate the sensor, and he let in enough light so that all the pixels were not perfectly black. I counted all the RGB values together in the above histogram.
figure(‘Name’,’red’); histogram(Img(:,:,1)); title(‘red’);
figure(‘Name’,’green’); histogram(Img(:,:,2)); title(‘green’);
figure(‘Name’,’blue’); histogram(Img(:,:,3)); title(‘blue’);
I usually write Javascript programs for this sort of thing. But in a hurry.
Here are the three plotted together for that clip near the star
Bins = (0:255)’;
Red = Img(:,:,1);
Green = Img(:,:,2);
Blue = Img(:,:,3);
R = histc(Red(:),Bins);
G = histc(Green(:),Bins);
B = histc(Blue(:),Bins);
plot(Bins,R,’r’,Bins,G,’g’,Bins,B,’b’);
I clipped the Vega image from Simbad at https://simbad.u-strasbg.fr/simbad/sim-basic?Ident=Vega and ran that histogram (now it is written I just change the image).
I used a log scale because all the values are shoved up at the max of the sensor pixel range (lots of 255)
plot(Bins,R,’r’,Bins,G,’g’,Bins,B,’b’);
set(gca, ‘YScale’, ‘log’);
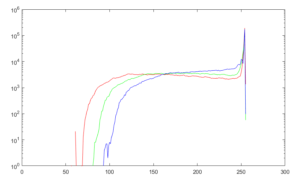
What this tells me is that most of the intensity is right at the center of that star and what we are taking pictures of is the much less bright scattered light from off axis. I doubt it is Gaussian. But never set things in stone. I like to guess, but I always verify. So I just need ways to chop that light up in to tiny pieces, and keep close tabs on each pixel in the process. The intensity falls off in a smooth manner, I just need more samples to work from.
Here is that plot with a linear Y axis. Need to cut the intensity range per image down to where it fits the sensor. My guess is that it needs something close to that Ryans picture at 1/30th second but
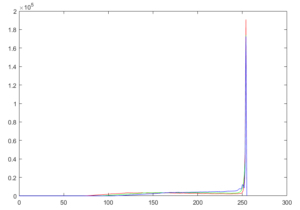
Ryans image at 1/30th second ISO 1600 was 12932.4 times larger than actual.
If he were taking video frames at 30*12932.4 frames per second it would probably not saturate, and give LOTS of data to try to derive a true picture of what is out there. (30*12932.4) is 387972 frames per second.
So probably center on Vega, keep some guidestars in the frame for centering and registration. Run it at high sampling rates, high frame rates, register and stack the frames. Look at the radial (outward from the center) and azimuthal (with some guideStars as reference) to see what can be gathered.
I don’t try to get “an answer”. I try many small steps and work every tiny piece hard, to learn the most, and to write tools and methods that can be used generally. My goal is to have tools that every human can use. I say “human” rather than “person on earth” because soon there will be humans in space and other planets and places outside Earth.
Vega has a rotation rate of about 12.5 hours or 360/(12.5*60) = 0.48 degree per minute. Its rotation axis is about 5 degrees from our line of sight, but I have not yet see then angle and direction. Its fast rotation implies that it will have a polar (central from our point of view) temperature of 10,200 Kelvin and an equatorial temperature (edge temperature from our point of view) of 7900 Kelvin, If there are equatorial sunspots they would move at (360/12.5) = 28.8 degrees per hour. So a thousand frames per second image sequence would need to be rotated by 0.48 degrees per minute or 8*10^-5 degrees per frame.
Rapidly Spinning Star Vega has Cool Dark Equator
https://noirlab.edu/public/news/noao0603/
In fact someone has already done the measurement, taking the rotation into account. Discovery of starspots on Vega, First spectroscopic detection of surface structures on a normal A-type star at https://www.aanda.org/articles/aa/full_html/2015/05/aa25425-14/aa25425-14.html
They recorded spectra over 5 nights for a total of 34.7 hours. Since the rotation rate will be stable, any stable structures on the disk will show some evidence of that in the light. The flux variations they measured were about 5*10^-4 (Watts/meter2) per total intensity in Watts/m2. They give a rotation period of 0.732 days per rotations or (0.732*24) = 17.568 hours per rotation. The important thing is the 5*10^-4 is (50E-4 * 1E6) = 5000 parts per million. That is a huge number in my world.
If Ryan can get about 4*pi*17^2 = 3631.7 pixels from an inexpensive telescope and camera, then adding a 480 frames per second camera to a 100×100 area would be 480*100*100 = 4.8 million pixel records per second for an off-the-shelf astrocamera (ZWO ASI).
This SyFy.com article called “A Planet for Vega” I found by looking for “sunspots” “Vega”. That picks up Roy Vega’s song too, but I don’t know the search results well enough to exclude anything yet.
“A Planet for Vega” at https://www.syfy.com/syfywire/a-planet-for-vega covers some good material. I am not particularly interested in distant planets yet, but imaging the surface and interior of distant stars fine enough to track sunspots also means this other data is going to be accessible. There is also a disk of dust orbiting Vega, apparently. And a possible planet.
“vega” “sunspots” “planet” gives 189,000 entry points on Google.
“vega” “extrasolar” “planet” has 3.03 Million entry points.
A giant, sizzling planet may be orbiting the star Vega at https://www.sciencedaily.com/releases/2021/03/210308112003.htm gives a journal article which I found on Arxiv.org
A decade of radial-velocity monitoring of Vega and new limits on the presence of planets at https://arxiv.org/abs/2101.08801 They used ten years from what I would call a hyperspectral telescope or hyper spectral camera with a telescope attached.
They say “The star is bright enough to fill the full well depth of hundreds of pixels”, so they use pixel well saturation (hitting the upper limit on the range of the digital tracking for each pixels) as a guide for planning and estimation. And they explain things in numbers of pixels affected or in certain categories. They make good use of a periodogram (looking for repeating elements) but only have a thousand frames to work with.
I will see if I can find or design a low cost hyperspectral camera that can run at 100,000 frames per second. and use log intensity with a wide range and precision. Getting people to look from different directions, pooling their raw data, using good time and intensity and spectral calibration, algorithm sharing, and everyone keeping permanent records for the whole Internet (all people) makes sense.
They used guideStars and reference stars nearby to calibrate the intensities. A global look would also help – if each observer also shares their calibrations and “best practices algorithms” are shared globally – along with all the data and tools used.
I read about MIE scattering and will keep all that in mind. I read about diffraction gratings and found this interesting page at RSpec-Astro.com where they show the spectrum for Vega take with an 8 inch telescope and a webcam. That is at https://www.rspec-astro.com/star-analyser/ but a better explanation is from Astro306 lectures by Chris Mihos and Paul Harding at Case Western Reserve University (my second university). That is http://burro.case.edu/Academics/Astr306/ and the lecture about gratings and “grisms” is at http://burro.case.edu/Academics/Astr306/Lectures/Spectroscopy2.pdf
On page 8, I found what I was looking for — “slitless spectroscopy” and a side by side picture of a “spectral image” and a “direct image” that show how the diffraction grating spreads every star image out into streaks of different colors. There are more examples, but they are too garish to understand easily.
Thanks, Chris, for explaining “angular dispersion” in radians (or degrees or arcseconds) per Angstrom (or nanometer or meter or as eV or cm-1). And “linear dispersion” in Angstroms per milliMeter.
Angstrom/pixel = (Angstrom/degree)*(degee/mm)*(mm/pixel) and other combinations.
This “Snapshot hyperspectral imaging using wide dilation networks” at https://link.springer.com/article/10.1007/s00138-020-01136-8 explains some trade off and introduces the term “snapshot hyperspectral imaging” to indicate “a complete spectrum for every pixel” (my ideal). And by using algorithms, not hardware (also my very very strong preference). I am not particularly happy they use deep learning jargon, most of which is good data management, never letting any information get lost, and a willingness to incrementally learn and test and accumulate precision.
It is a lot to read and translate. But they eventually chose “a transmitting double axis diffraction grating”. On google (“transmitting” OR “transmission” OR “slits”) (“double axis” OR “two axis”) “diffraction” (“grating” OR “gratings”) gives 359,000 entry points. And the most frequent results are two axis diffraction grating sheets with 13,750 lines per inch or 300 lines per millimeter (lines/mm).